As an introductory article, let's share with you the performance parameters of the power battery. Although these parameters are relatively theoretical, they are the most basic elements of the power battery, just like a key, through which the power battery can be evaluated. Good or bad, can open this door.
Energy density (Wh/L&Wh/kg)
The energy released per unit volume or unit mass of battery.
If it is unit volume, ie volume energy density (Wh/L), many places are directly referred to as energy density;
If it is unit mass, it is mass energy density (Wh/kg), and many places are called specific energy.
If a lithium battery weighs 300g, the rated voltage is 3.7V, and the capacity is 10Ah, its specific energy is 123Wh/kg.
According to the “Technology Roadmap for Energy Saving and New Energy Vehicles†released in 16 years, we can probably have a concept about the development trend of power batteries. As shown in the following figure, by 2020, the specific energy of pure electric vehicle battery cells should reach 350Wh/kg. .

Dividing the energy by the time gives the power in units of W or kW. By the same token, power density refers to unit mass (somewhere also called specific power) or power output per unit volume of battery, in W/kg or W/L.
Specific power is an important indicator to evaluate whether the battery meets the acceleration performance of electric vehicles.
What is the difference between specific energy and specific power?
Give an example of an image:
The power battery with higher energy than the turtle is like a tortoise in a tortoise and a hare race. It has good endurance and can work for a long time to ensure a long battery life.
The power battery with higher power than the rabbit in the tortoise and the hare race is fast and can provide a high instantaneous current to ensure the car's acceleration performance.
Battery discharge rate (C)
The discharge rate is the current value required to discharge its rated capacity (Q) within a specified time, which is numerically equal to a multiple of the rated capacity of the battery.
Namely: charge and discharge current (A) / rated capacity (Ah), the unit is generally C (C-rate short), such as 0.5C, 1C, 5C, etc.
For example, for a battery with a capacity of 24Ah:
With 48A discharge, the discharge rate is 2C. Conversely, 2C discharge, discharge current is 48A, and discharge is completed in 0.5 hours;
Charging with 12A, its charging rate is 0.5C, conversely, 0.5C charging, charging current is 12A, 2 hours charging is completed;
The charge and discharge rate of the battery determines how fast we can store a certain amount of energy into the battery, or how fast the energy inside the battery is released.
State of charge (%)
SOC, the full name is StateofCharge, the state of charge, also called the remaining power, represents the ratio of the remaining capacity of the battery after discharge to its fully charged state.
The value ranges from 0 to 1. When SOC=0, the battery discharge is complete. When SOC=1, the battery is fully charged. The Battery Management System (BMS) is the core of battery management by managing the SOC and estimating it to ensure efficient battery operation.
At present, the SOC estimation mainly includes open circuit voltage method, Ansue measurement method, artificial neural network method, Kalman filter method, etc., which we will explain in detail later.
Internal resistance
Internal resistance refers to the resistance that current flows through the interior of the battery while the battery is in operation.
Including ohmic internal resistance and polarization internal resistance, wherein: ohm internal resistance includes electrode material, electrolyte, diaphragm resistance and resistance of each part; polarization internal resistance includes electrochemical polarization resistance and concentration polarization resistance.
Speak with data, the following figure shows a battery discharge curve, the X axis represents the discharge amount, the Y axis represents the battery open circuit voltage, the ideal discharge state of the battery is a black curve, and the red curve is the real state in consideration of the internal resistance of the battery.
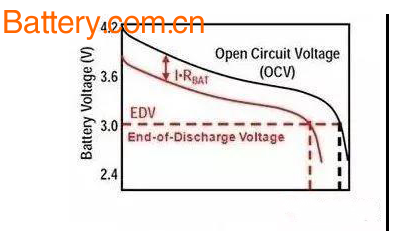
As can be seen from the figure, the actual battery capacity Quse < the theoretical maximum chemical capacity Qmax of the battery.
Due to the presence of the resistor, the actual capacity of the battery will decrease. We can also see that the actual battery capacity Quse depends on two factors:
The product of the discharge current I and the battery internal resistance Rbat, and the discharge termination voltage EDV.
It should be pointed out that the battery internal resistance Rbat will gradually increase with the use of the battery.
The unit of internal resistance is generally milliohm (mΩ), and the battery with large internal resistance has large internal power consumption and serious heat generation during charging and discharging, which will cause accelerated aging and life decay of the battery, and also limit the charging of large magnification. Discharge application. Therefore, the smaller the internal resistance is, the better the battery life and rate performance will be. Usually, the internal resistance of the battery is measured by AC and DC test methods.
Self-discharge
The self-discharge of the battery refers to the phenomenon that the voltage drops during the process of the open circuit, which is also called the charge retention capability of the battery.
In general, battery self-discharge is mainly affected by manufacturing processes, materials, and storage conditions.
Whether the self-discharge is reversibly divided into two types according to the capacity loss: the capacity loss is reversible, meaning that the capacity can be recovered after the recharging process; the capacity loss is irreversible, indicating that the capacity cannot be recovered.
At present, there are many research theories on the cause of self-discharge of batteries. In summary, they are divided into physical reasons (storage environment, manufacturing process, materials, etc.) and chemical reasons (electrode instability in the electrolyte, internal chemical reactions, active substances are consumed. Etc.), battery self-discharge will directly reduce the battery capacity and storage performance.
life
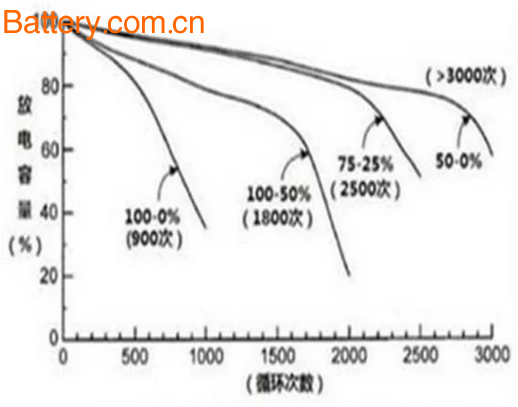
Battery life is divided into two parameters: cycle life and calendar life. Cycle life refers to the number of times the battery can be cycled for charge and discharge.
That is, under ideal temperature and humidity, charging and discharging are performed at a rated charging and discharging current, and the number of cycles experienced when the battery capacity is attenuated to 80% is calculated.
Calendar life refers to the time span of the battery under the conditions of use and the end of life conditions (capacity decay to 80%) after a specific use condition. The calendar life is closely integrated with the specific usage requirements, and it is usually necessary to specify specific usage conditions, environmental conditions, storage intervals, and the like.
Cycle life is a theoretical parameter, and calendar life is more practical. However, the calculation of the calendar life is complicated and takes a long time, so the general battery manufacturer only gives the data of the cycle life.
Battery pack consistency
This parameter is more interesting. Even after the battery cells of the same specification type are grouped, the performance of the battery pack in voltage, capacity, internal resistance, and life is very different. When used on an electric vehicle, the performance index often does not reach To the original level of the single battery.
The current reasonable explanation:
After the single cell is manufactured, due to the process problem, the internal structure and material are not completely consistent, and there is a certain performance difference.
The initial inconsistency is accumulated along with the continuous charge and discharge cycle of the battery during use, and the use environment in the battery pack is not the same for each single cell, resulting in a larger difference in the state of each cell. Gradually magnifying during use, in some cases, accelerates the attenuation of certain single cell performance and eventually causes premature failure of the battery pack.
It should be pointed out that the performance of the power battery pack is determined by the performance of the battery cells, but it is by no means a simple accumulation of the performance of the battery cells. Due to the inconsistent performance of the single cells, when the power battery pack is repeatedly used on an electric vehicle, various problems occur and the life is shortened.
In addition to requiring strict control of the process and consistency of the cells in the production and assembly process, the industry generally uses a battery management system with equalization function to control the consistency of the battery in the battery pack to extend the product. Service life.
Turn into
Let's talk about the last parameter, which is mainly related to the manufacturing process of the battery.
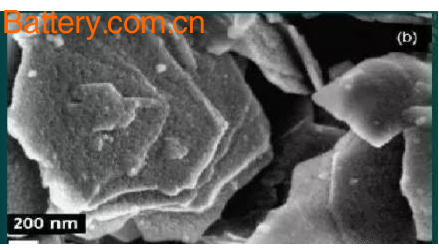
After the battery is made, it is necessary to charge the battery with a small current, activate the internal positive and negative materials, and form a passivation layer on the surface of the negative electrode - SEI (solid electrolyte interface) film, so that the battery performance is more stable, after the battery is formed. In order to reflect its true performance, this process is called chemicalization.
The sorting process in the formation process can improve the consistency of the battery pack and improve the performance of the final battery pack, and the formation capacity is an important indicator for screening qualified batteries. The picture below shows the SEI film, unlike a black rose.
Through the article, we basically sum up all the performance parameters related to the power battery, I hope to help everyone, and will not be a "outsider" when talking about the battery.
The Spring Feeder Machine is the combination of the Spring Separator and the Bowl Feeder, the spring separated by the Spring Separator, and then sent automatically through the Vibratory Bowl, positioned and discharged.
The Spring Feeder Machine includes separator, vibration bowl, direct vibration, frequency modulation voltage controller, cylinder, fixed bracket, bottom board, etc.
Spring Feeder Machine,Spring Feeding Machine,Spring Feed Machine,Automatic Spring Feeding Machines
Dongguan Rener Automation Technologies Co.,Ltd , https://www.rener-automation.com